Tsunami
The 2004 Indian Ocean Earthquake and Tsunami
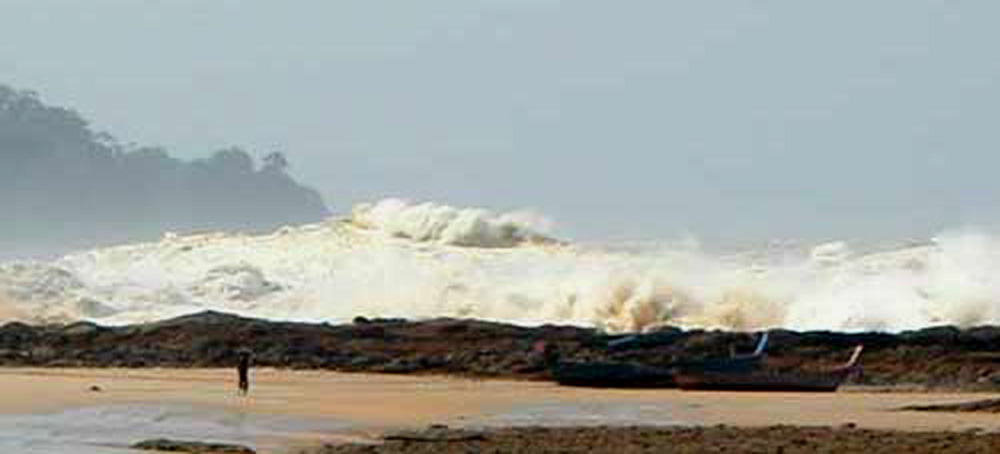
The dreadful moment when the Tsunami of 26 December 2004 hits the Thai coast after travelling ca. 400 km around the northern tip of Sumatra and then WNW across the Andaman sea and the Strait of Malacca. The coast shown in this photograph is "sheltered" (if that is quite the word for it in these circumstances) by Sumatra. The epicentre of the earthquake was on the far side of Sumatra and the tsunami had to work its way around the northern tip of that island, losing a lot of energy in the process. The photograph captures only too clearly the tremendous power that even a weakened major tsunami can have.
The human figure on the left and the boats on the right can give a sense of scale. The unknown photographer did not survive and the same must be assumed for the human being. The camera was found later with the film intact (see Tsunami: the Tragedy in pictures). The exact part of the coast shown has not been identified. The breaking wave appears to be roughly 5-6 m high, which compares with the unimaginable wave of 30 m or even more that hit the town of Aceh much closer and in direct line to the epicentre (for maps see below).
|
Table of Contents
Earthquake and Tsunami The Cause: moving geological plates Earthquake: the first Disaster The Big One: the Richter scale 9.0 event of 26 December 2004 Difference between tsunami and storm waves The Tsunami spreads: countless local disasters Sumatra The Sequence of events 26 December 2004 to 27 April 2005
|
The Cause: moving geological plates
The Indo-Australian plate moves below the Eurasian plate at around 70 mm per year on average. Plates get locked and move very little for many years, even centuries, pressure builds up - and is then suddenly and catastrophically released in the form of a major earthquake. This happened on 26th December 2004 below Sumatra on the fault line between the Indo-Australian and the Eurasian plates.
The major plates often have smaller plates at their edges. These minor and micro- plates tend to move, more or less, in the same direction as the major plates they belong to but are often the location of specially active geological fault lines.
|
|
Plate tectonics - major plates: |
|
|
The plate tectonics behind the 2004 earthquake: ____ major plate boundaries ________ Minor and micro-plate boundaries 1 epicenter of 26 Dec 2004 quake 2 epicenter of 28 Mar 2005 quake
CIDZ = Central Indian Ocean Deformation Zone, the fault line between the Indian and Australian plates.
|
|
|
Active tectonic elements in the Sumatra-Nicobar-Andaman area. Faults: Vectors: The vectors show that subduction is taking place all along the trench at various angles |
|
|
A tectonic map of the northeastern Indian Ocean
|
Earthquake: the first disaster
The Big One: the Richter scale 9.0 event of 26 December 2004
|
|
Rupture zones and slip mechanism for the earthquakes of 26 December 2005 and 28th March 2005 are shown below. The total length of the two ruptures exceeds 1,600 km. (Graphic courtesy Bilham R. 2005. "A Flying Start, Then a Slow Slip". Science 308:1126-1127, 20 May 2005). white outlines: historical earthquakes with year and magnitude red line: Andaman fault system terminated by the Andaman spreading center (sawtooth portion)
The tsunami was generated by the southern 650 km of the quake of 26 December 2004. Seismic estimates of slip are quite heterogeneous both along strike and down dip, but they agree well with estimates of mean slip (white arrows left) and black ractangles (center) derived from GPS analysis. Representative magnitudes are calculated for various segments assuming uniform sli (center). Right: the panel illustrates the northward-increasing delay between the fast rupture front (sine wave), subsequent downdip slip (square wave) and aftershocks (smoothline). |
Rupture progression with indication of energy radiation from 30 to 420 seconds after earthquake initiation 26 December 2004. The entire rupture event lasted 8 mins (480 sec). long.The epicenter is marked by a red star off Simeulue island near Sumatra. (ref. Ishii M., Shearer P.M., Houston H., and Vidale J.E. 2005. "Extent, duration and speed of the 2004 Sumatra-Andaman earthquake imaged by the Hi-Net array." Nature 435:933-936).

|
|
Cumulative radiated seismic energy over 600 secs after initiation on 26 December 2004 black star: epicentre green dots: aftershocks during the first month after the quake contour lines: plotted at increments of 0.1 and starting at 0.5. The image is plotted over the entire map but amplitudes are very weak in the area coloured blue outside the contoured(red-brown and yellow) region. (ref. Ishii M., Shearer P.M., Houston H., and Vidale J.E. 2005. "Extent, duration and speed of the 2004 Sumatra-Andaman earthquake imaged by the Hi-Net array." Nature 435:933-936). |
Sequence of events on 26 December 2004
07:58 (local time at Aceh, northwest Sumatra, Indonesia). 60 km off the west coast of northern Sumatra, at 10 km depth, the Indo-Australian plate slides further under the Eurasian plate which is instantly lifted by about 10 m. The energy released is equivalent to around 10,000 atomic bombs. A gigantic volume of water is set in motion in the form of a monstrous wave that moves off in all directions. Initially the speed of this wave is 700 km/h and its height 37 m.
07:59. The official geophysicist on duty at Padang, Indonesia, notes that his seismopraph has recorded an earthquake ofintensity 8 on the Richter scale. He tries to notify the National Earthquake Centre in Jakarta but cannot get through.
08:14. The Pacific Tsunami Warning Centre registers an earthquake. "I know at once that this was no puny thing, perhaps a 7", said someone at the Center. Together with a colleague, he does some detailed calculations and reaches the conclusion that the quake must have been an 8.0 on the Richter scale. This news is distributed in a Bulletin that goes to many countries, among them Indonesia and Thailand. Other coastal regions of the Indian Ocean do not get the news since they are not connected to the warning system for the Pacific Ocean. In Thailand there are discussions if perhaps the quake had started a Tsunami. On the interest of tourism it is decided not to give out a warning. "Five years ago we gave such a warning after an earthquake in Papua-Newguinea, but the tourism authority complained and told us that this was damaging the tourist industry," a seismologist said in Bangkok.
08:20. The Tsunami breaks over the Sumatran city of Banda Aceh.
08:31. In Australia, an alarmed official sends a Tsunami warning to all Australian embassies. Endangered countries are not warned, apparently out of fear that diplomatic protocol could be broken. Worldwide the most highly equipped earthquake observation center with 300 monitoring stations is the organsiation to monitor observation of the trreaty prohibiting nuclear test explosions, based in Vienna/Austria. This organisation, which ould be best qualified to evaluate the incoming signals and issue warnings, remains quiet. The organisation's computers note the situation without human help. It is a public holiday and no staff are present.
08:45. The two scientists at the Pacific Tsunami Warnuing Centre refine their analyses. They now find that the quake had a force of 8.5. Now seriously worried, they call their boss. He sugggests that a new warning is issued but he does not think that a quake of this magnitude could cause a destructive Tsunami posing a threat.
08:54. The meteorological service of India sends a warning per fax - unfortunately not to the responsible minister of science but to his predecessor who has been out of office since the change of government in May 2004. One hour later, he sends another fax, this time to the responsible control centre at the Ministry of the Interior. Another hour passes before the cabinet is informed - at that time many thousands are already dead. The country "leading worldwide in call centres, did not manage to use telephones in such a case", one commentator said.
08:59. Agence France Press reports the earthquake but not the tsunami.
09:04. The Pacific Tsunami Warning Center on Hawaii corrects the strength of the earthquake in its bulletin to 8.5 and mentions the possibility of a local tsunami. The connection between the strength of an earthquake and the tsunami is not clear-cut: not every earthquake lifts the sea floor and causes a tsunami.
09:50. The tsunami reaches the Thai holiday resort of Phuket. A little later it reaches the coastsof southern India and Sri Lanka.
10:31. The Pacific Tsunami Warning Centre first sees news bulletins of a news agency on the internet where deaths in Sri Lanka are reported. For them, this is the first hint at the power of the tsunami. They cocnluded that "more will die." They try to send more warnings to the region but find that they "do not have the telephone number of a single person in that area".
10:40. News agencies report firth deaths in Phuket.
11:00. The British BBC reports 150 dead in Sri Lanka. Thai officials confirm 4 dead in Phuket.
11:05. The tsunami reaches Male, the capital of the Maldive islands. "The islands are only about 1 m above sea level and a wave of 1.5 m went right over us," says a government official.
12:25. The Tsunami spreads further in the Indian Ocean. Scientists from the American Harvard University send out an E-mail in which they state that they have calculated a force 8.9 on the Richterscale for the earthquake. That means that the quake was ten times as strong as originally assumed. Now it becomes clear why the quake could cause such a monstrous tsunami. The last quake with comparable strength took place 40 years ago in Alaska.
13:01. The Pacific Tsunami Warning Centre issues a warning that tsunamis could form in the western parts of the Indian Ocean.
14:00-15:00. The tsunami reaches the coasts of Somalia and Kenya in eastern Africa.
15:00. The news agencies now report at least 150 along the coast of southern India, 400 dead in Sri Lanka and 21 dead in Phuket, among them some tourists.
Evening. There is talk of 11,000 dead.
Shocks and Aftershocks
For a frequently updated analysis of aftershocks see http://www.gsi.gov.in/suma_eq.htm
|
|
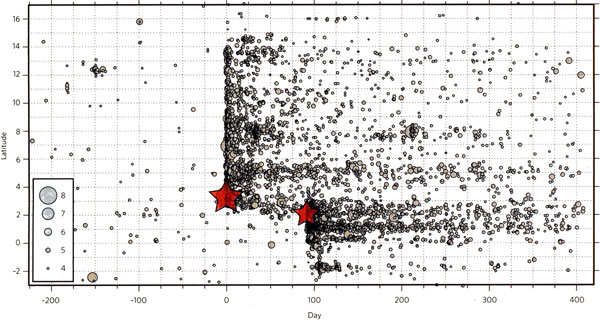
Seismic activity before, during and after the great 26 December 2004 quake, including seismic events beneath the Andaman Sea. Each circle represents an earthquake of a strength proportional to the size of the circle The two red stars represent the two main quakes: Day 90 event: 28 March 2005 More than 5,000 aftershocks have been located and activity continues across the region Chart from Ch. J. Amman "Megathrust Investigation", Nature, 2 March 2006, 440:31-32 |
|
|
The main- and the after-shocks between 26 and 29 December
2004 Yellow star: main shock of 26 December 2004. |
|
|
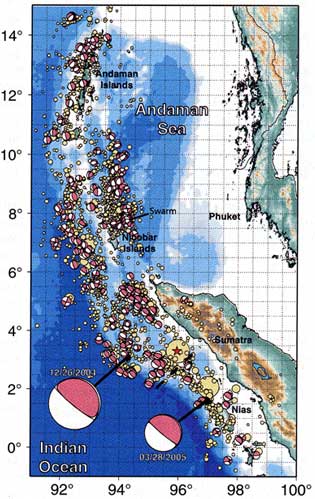
The main- and the aftershocks for the 13 weeks (26 December 2004 to 26 March 2005) following the earthquake and tsunami of 26 December 2005 Yellow dots: recorded aftershocks, radii proportinal to seismic magnitude Star in large yellow dot: main event of 26 Dec 2005 White/pink circles: moment tensor solutions (shown enlarged for the two main events of 26 December 2004 and 28 March 2005) Map courtesy Lay T., Kanamori H., Ammon Ch.J., Nettles M., Ward S.N., Aster R.C., Beck S.L. Bilek S.L., Brudzinski M.R., Butler R., DeShon H.R., Ekström G., Satake K., and Supkin S. 2005. "The Great Sumatra-Andaman Earthquake of 26 December 2004". Science 308:1127-1133, 20 May 2005 |
The Richter scale 8.7 event of 28 March 2005 (Simeulue/Nias islands)
|
|
28 March 2005 11:09:36 local time at epicenter Magnitude 8.7 (other estimates: 8.2, 8.5 and 8.9) Epicenter off southwestern coast of Sumatra, Indonesia
2.074°N, 97.013°E, off the west coast of Sumatra
between the islands of Simeulue and Nias. |
At least 290 people killed, 100 injured and 300 houses destroyed on Nias island by the earthquake and fears 500 to 2,000 dead on Nias have been voiced. There are also likely to be some hundreds of dead on neighbouring Simeulue island (already hit hard be the first tsunami in December 2004) and in the Batu islands, with extensive damage to housing and infrastructure.
Tremors were felt in Indonesia, Malaysia, Singapore and as far north as Bangkok, Thailand.
No major tsunami has been triggered by this quake and what waves were generated seem to have been focused towards the south and southwest. The near-absence of a tsunami in this quite powerful quake was thought to have been the dominance of horizontal and the near absence of vertical movement. This may still hold true, up to a point, but computer modelling done on the 28 March 2005 earthquake by US scientist C. Synolakis (ref. Kerr R.A. 2005. "Model Shows Islands Muted Tsunami after latest Indonesian Quake", Science 308:341, 15 April 2005) shows that the quake did generate a tsunami but that this was damped into near-insignificance by the presence of islands (above all Simeulue and Nias). This simulation reflected he reality of the actual quake. When he removed the islands from his model, the tsunami generated was much larger and spread much more widely (map to the right below (from Kerr's article in Science 308:341). The results mean that tsunami intensity and reach will be much harder to forecast than had been hoped. The magnitude of a quake alone will not suffice for a reliable forecast, the exact position of the epicenter and its geographical surroundings have to be taken into consideration, too. As Kerr notes "only a dense network of tsunami detectors on the ocan floor will do."
|
|
Map courtesy US Geological Survey |
The Richter scale 6.8 event of 10 April 2005 (Siberut island)
|
|
10 April 2005 at 10:29:13 local local time at epicenter Depth 30 km (18.6 miles) Epicenter off southwestern coast of Sumatra, Indonesia
3.9°S, 99.551°E, off the southeastern eastern tip
of Siberut island (the largest of the Mentawai group of
islands). Tremors were felt in Indonesia, Malaysia and Singapore. No tsunami was triggered and no casualties caused by this quake. |
The Richter scale 6.7 event of 5 July 2005 (Nias island)
|
|
5 July 2005 at 01:52:02local time at epicenter Location 1.836°N, 97.034°E Depth 21 km (13.0 miles) Damage to building and roads in Gunungsitoli area. Felt at Sibolga, Sumatra. Felt at Medan and Pematangsiantar, Sumatra. Also felt at Kelang, Kuala Lumpur, Petaling Jaya, Shah Alam, and Sungai Ara, Malaysia. No tsunami was triggered and no casualties caused by this quake. |
The Richter scale 7.2 event of 24 July 2005 (Nicobar islands)
|
|
24 July 2005 at 15:42:05 local time at epicenter Magnitude 7.2 Location 7.926°N, 92.146°E Depth 10 km (6.2 miles) The US Geological Survey comments as follows: This earthquake occurred near the western boundary of the aftershock zone of the devastating 26 December 2004 earthquake. The aftershock zone of the 26 December earthquake continues to be active and forms a crescent-shaped region extending about 1200 km north of Sumatra, Indonesia. The recent event was a strike-slip earthquake in the Burma plate near its boundary with the India plate. Strike-slip earthquakes generate horizontal motion across a fault. This is unlike the motion caused by the 26 December earthquake that was the result of thrust-faulting on the interface of the India plate and the Burma plate, in which the India plate thrust beneath the overriding Burma plate. Given the different mechanisms, the recent event did not occur on the same fault that caused the Great Sumatra-Andaman Islands earthquake. |
The Richter scale 4.6 event of 26th October 2005 (Simeulue island)
|
|
26 October 2005 at 19:41:01 local time at epicenter Location 7.926°N, 92.146°E Depth 57 km (35.5 miles) No tsunami was triggered and no casualties caused by this quake. |
The Richter scale 6.5 event of 19th November 2005 (Simeulue island)
19 November 19, 2005 at 21:10:15 local time at
epicenter Location 2.232° N, 96.769° E Depth 30 km (18.6 miles) No tsunami was triggered and no
casualties caused by this quake.
Difference between tsunami and storm waves
A wave is not "water moving"; it is energy passing through water, agitating the water molecules and then leaving the same molecules behind (except when a wave breaks on a coast when water is indeed "moved" if only briefly onto land). The energy of waves in the drawings below is symbolised by a circle or an oval.
Wind-created waves do not reach deep below the surface although in severe storms they can reach heights of 7 m or more ( "freak waves" can go much higher, they are very rare and their origin is not well understood). A few meters below a surface whipped by a raging storm, all is quiet.
Tsunami waves are quite different. On seas with a depth of 4000 m or more, the tsunami's height on the sea surface may be less than 0.8 m and hardly noticeable. Indeed, almost all of the tsunami's energy is below the sea surface and sailors may not even notice a major tsunami wave passing under their ship.
in shallow seas and very close to the epicentre, tsunami waves have been known to reach around 40 m in height. On Haiwaii traces of ancient prehistoric tsunamis have been found that indicate a height of over 300 m. The troughs The size of the troughs between the waves depends on the way the waves were formed but they can can be as much as 160 km widee with a depth of only a few meters. The pictures below are not to scale as regards the height-to-width of tsunami waves!
How a tsunami starts - in principle
|
|
1. Before the earthquake: 2. During the earthquake 3. Tsunami waves travelling in deep water: 4. Tsunami waves hitting land: |
How the tsunami destroys - in principle
|
|
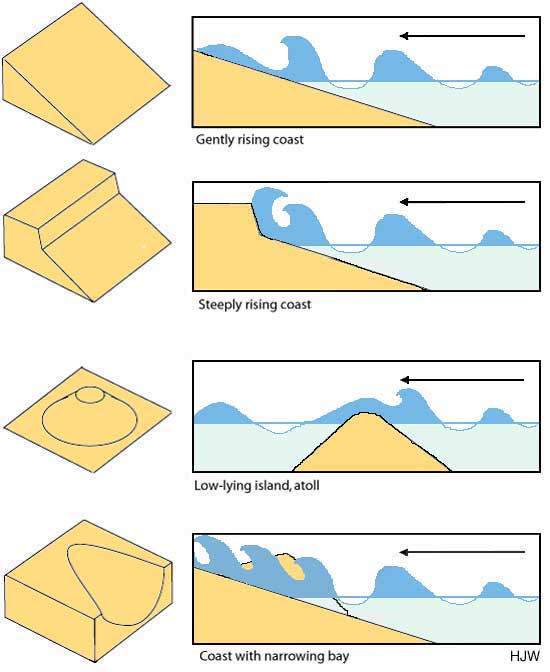
The depth and topography of the sea determines the form a tsunami wave takes and how it propagates. The way a tsunami breaks when reaching a coast is very difficult to predict. It depends on the topography that the wave has passed over on the high seas and on the form, steepness, height and form of the coastline hit. Within a few kilometers the hight of a tsunami wave can vary from lesss than a meter to 20 or more meters.
Light blue: normal sea level Dark blue line: normal water surface Dark blue: tsunami wave reaching higher than normal sea level brown: land |
|
|
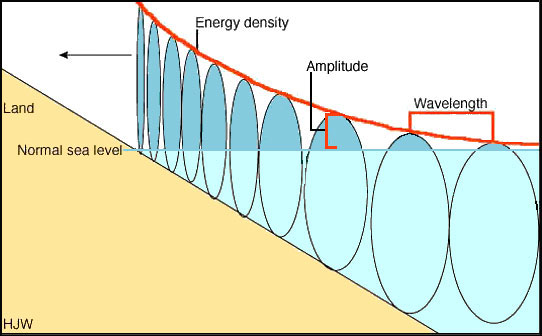
A wave is not "water moving"; it is energy passing through water, agitating the water molecules and then leaving the same molecules behind (except when a wave breaks on a coast when water is indeed moved briefly onto land). The drawing illustrates the wave energy of a tsunami wave in the form of an oval. If the oval does not touch sea bottom, the wave will barely rise above the normal sea level (shown light blue). The shallower the sea is that the tsunami wave is passing through, the more the wave rises above the normal sea level (i.e. the wave amplitude increases), the more it slows down and the closer the waves crowd together (i.e. the higher the energy density becomes). Light blue: normal sea level |
How the tsunami of 26 December 2004 started
|
|
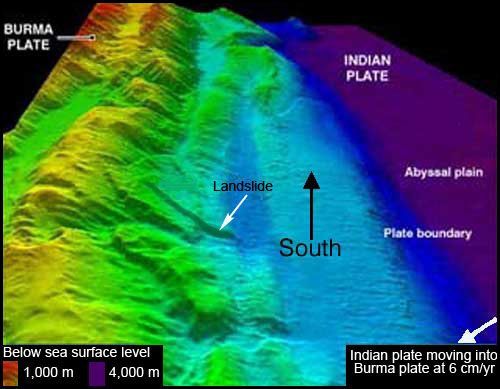
Underwater landslides caused by submarine earthquakes are a major (perhaps usually the only) contributory factor to the formationof a tsunami wave. One enormous landslide off the west coast of Sumatra caused by the the quake of 26 Dec 2004 was discovered by the sonar of the British Navy's "HMS Scott" and is shown on the left. The view is to the south. (Picture courtesy Royal Navy). |
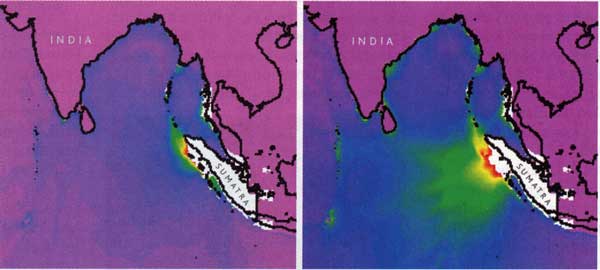
How the tsunami of 26 December 2004 spread
|
|
The configuration in 3 dimensions of the newly-born tsunami, approx. 15 minutes after its creation. The view is towards north-west. Note that the highest waves (around 37 m) were around the unfortunate city of Banda Aceh at the northern tip of Sumatra. For more pictures and an animated 17 MB movie of the expanding tsunami, see: http://walrus.wr.usgs.gov/tsunami/sumatraEQ/SumatraNW1pic.html |
|
|
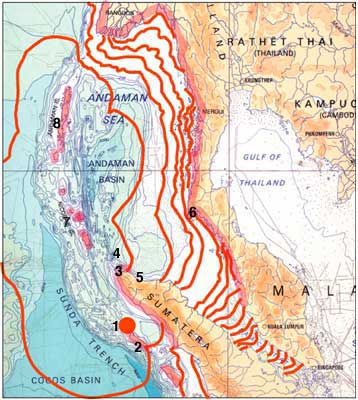
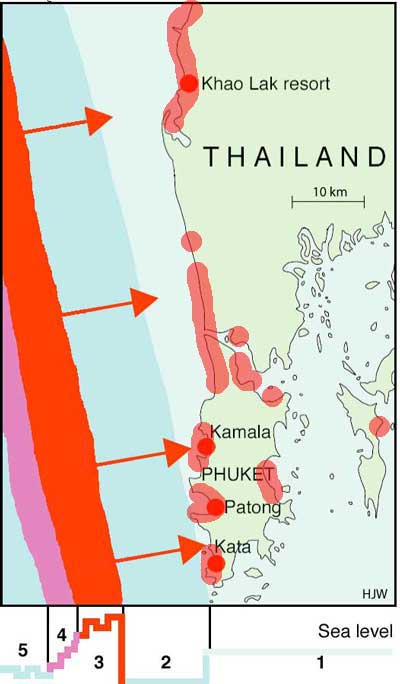
The red lines show the tsunami front at half-hourly intervals. The background shows the sea depth contours and is from Manfred Leier, World Atlas of the Oceans, 2000, Firefly Books, Buffalo NY, USA. From the epicenter of the primary earthquake (1), the tsunami spreads out at, initially, around 700 km/h and with a starting height of 37 m. By the time the wavefront has reached Banda Aceh (3), its height has already been reduced to "only" 12 m, when reaching the island of Sabang (4) it is 6 m and when reaching the coast near Sigli (5) east of Bandar Aceh it is 5 m in height. The estimates of the tunami's early height are based on the extent and distance from the sea of damage caused. After clearing the northern tip of Sumatra, the tsunami does not lose significant hight anymore but instead slows down in the shallower waters. When the Tsunami reaches the Thai island of Phuket (6) it still produces heights of 4.5 m (Karon beach) and 5.5 m (Patong beach). Because the power of the tsunami was deflected by Simeulue island (2) immediately to the south of the epicentre and by the west coast of Sumatra, much of the wave energy was deflected to the west and the north. The short time delay between initial and deflected wave energy also caused two tsunamis to move closely together northwards to the Nicobar (7) and Andaman (8) islands. Coastlines and islands with significant loss of life and serious coastal damage are coloured red.
For photographs of the damage caused by the tsunami, see Pictures |
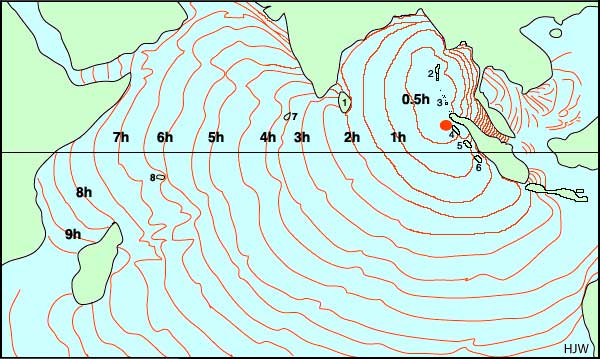
The map below shows just how far and how quickly the tsunami travelled and how far. Human casualties were reported from East African beaches 7-8 hours after the main earthquake near Sumatra. The height of the tsunami had reduced to around 0.5 m by the time it reached the African coast. This may not sound much but if someone is taken completely by surprise, even such a relatively small wave can still be deadly.
The red lines show the progress of the tsunami across the Indian Ocean in half-hourly intervals. It is noticeable that the speed of the tsunami's advance is not significantly slowed down as long as the wave moves in deep waters.
|
|
1. Sri Lanka 2. Andaman islands 3. Nicobar islands 4. Simeulue island 5. Nias island 6. Mentawai islands 7. Maldive islands 8. Seychelle islands |
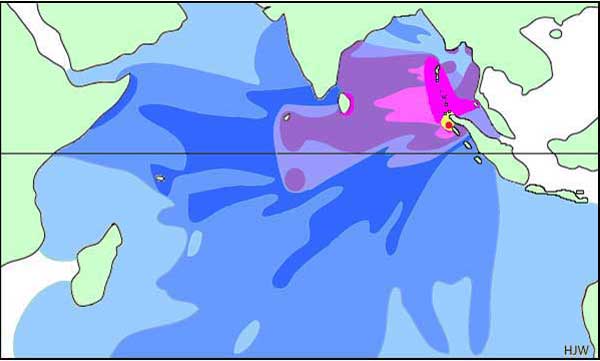
The wave hight in meters (m) at any time during the tsunami
(modelled)
(adapted and simplified from Quirin Schiermeier, "On the Trail of
Destruction", Nature 433:350-353, 27th January 2005.
|
|
1 m = 3.28 ft. |
The Tsunami spreads: countless local disasters
Sumatra
While in most areas around the Indian Ocean that suffered serious damage from the event of 26 December 2004, it was not so much the earthquake but the following tsunami that caused the horrific loss of life and damage. The western coast of the northern Indonesian province of Aceh and its capital, Banda Aceh, suffered especially grievously. This is the landmass closest to the epicentre of earthquake and tsunami.
The loss of life along the western coast of Sumatra (marked in red below) has been enormous and the destruction of infrastructure (houses, bridges, roads , harbours, agricultural land) nearly total. That the province had suffered for decades from a vicious civil war did nothing to improve the situation. That war was stopped only briefly after the disaster and has resumed since makes reconstruction even more difficult.
|
|
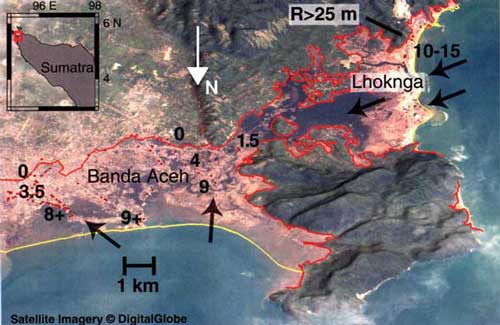
Height of the tsunami: Banda Aceh (northeast areas): 9 m Banda Aceh (southwest areas): 25-31 m Sabang island: 6 m Nasi island (northwest of Banda Aceh): 8 m Sigli (east of Banda Aceh): 5 m Simeulue island: 15 m
|
|
|
The devastation of Banda Aceh: yellow line: shore line prior to the tsunami red line: extent of inundation by the tsunami red spots: measurement locations of tsunami flow depth and direction black numbers: representative measurements of tsunami flow depth (in m), in the citxy centre the depath was between 4 and 9 m (1 m = 3.28 feet) black arrows: direction of tsunami flow R: runup in the Lhoknga area (in direct line to the epicentre of the earthquake) exceed 25 m and may have reached 31 m
Graphic courtesy Borrero J.C. 2005. "Field Data and Setellite Imagery of Tsunami Effects in Banda Aceh." Science 308:1596 (10 June 2005)
|
The Andaman and Nicobar islands, including North Sentinel island
Map showing the aftermath of the 26 December 2004
earthquake and tsunami in the Andaman and Nicobar
islands:
(1) the dead and missing for each locality with figures
available,
(2) +/- figures in meters of post-earthquake seismic uplift
(for only the Indira Point measurement are the data
corrected for the tidal range).
(3) elevations of marine terraces (indicative of ancient
uplifts/earthquakes) are given in parentheses (T 18-22
m).
(ref. Bilham R., Engdahl E.R., Feldl N., Satyabala S.P.
2005, "Partial and Complete Rupture of the Indo-Andaman
Plate boundary 1847-2004", PDF file under http://cires.colorado.edu/~bilham/
). Reproduced with permission courtesy Dr. R. Bilham.
North Sentinel island is the part of the Andamans that has suffered the most extensive geological changes. In human terms, this tiny, 72 square kilometer is land is among the strangest inhabited lands not only in the Andamans but on this planet. It is inhabited by an Andamanese tribe, the Sentineli, also called Sentinelese. What they call themselves is not known. This tiny tribe has been steadfast for centuries in refusing any contact with the outside world. The refusal continues to this day and has survived several Indian attempts to establish "friendship" and it has survived the earthquake and tsunami of December 2004. For more details on the Sentineli see Chapter 8 The Tribes.
Estimates of the Sentineli population range from 70 to 500 individuals - which nicely illustrates how little we known about them. For what little more detail that is available see Sentineli.
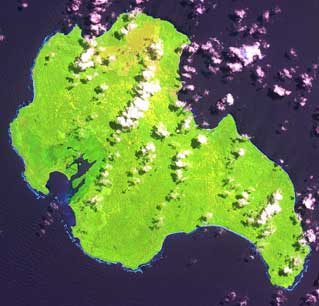
North Sentinel island before the earthquake and tsunami
of late December 2004 in a Google Earth picture. Photographs and map with explanation of the following
North Sentinel sequence curtesy Peter
Minton,

The island is roughly 10 km from east coast to west
coast.
EVS Islands, San Diego, California, USA.
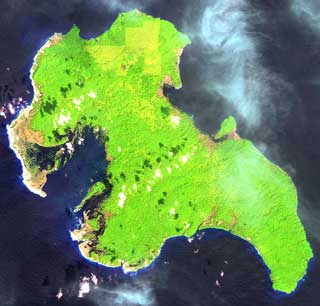
North Sentinel island in January 2005. It was initially thought that the Sentineli would at the
very least suffer food shortages from the loss of their
shallow-water fishing grounds. With the coastline changed
beyond recognition around most of the island, the wildlife
would have been destroyed, it was (reasonably) thought. Amazingly, the tribe (and the wildlife on which it lives)
seems to have coped and adapted to the new conditions with a
wholly unexpected flexibility. What little is known about
the present situation on the island indicates that the
Sentineli and the island's wildlife seem to have coped and
to continue to cope admirably.

The whole coastal geography has changed completely. For a
close-up of the raised coral reefs see the photograph
immediately below.
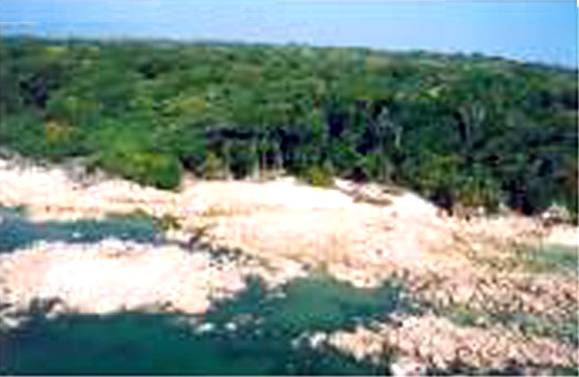
Aerial photograph of a part of the North Sentinel coast
taken by an Indian reconaissance flight in January 2005. The yellowish-brown areas are the previously submerged
coral reefs that in the space of a few minutes were raised -
permanently, above sea level to become dry land.
Below: map of the "new" post-earthquake-and-tsunami geography
North Sentinel island.
Base imagery: Landst ETM+ and ESA. Land above sea level: 10 m
interval contour lines. Imagery curtesy Peter
Minton San Diego, California, USA

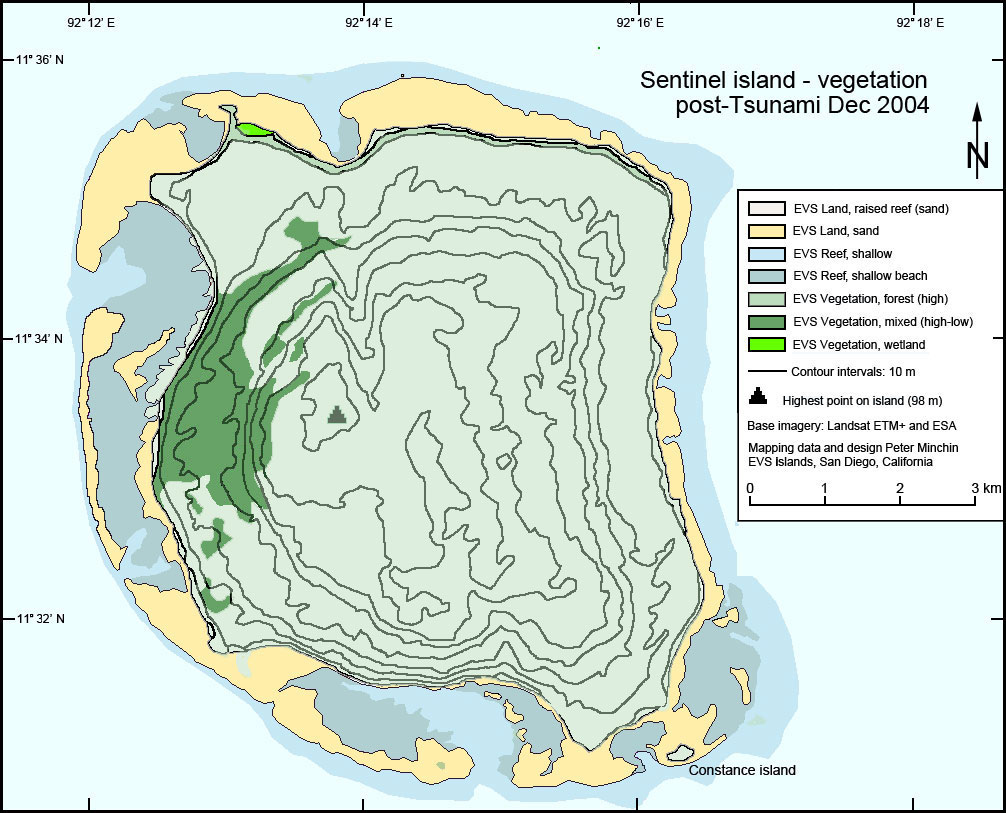
Below: map of the vegetation types with the post-tsunami coastline
of North Sentinel island.
Base imagery: Landst ETM+ and ESA. Land above sea level: 10 m
interval contour lines. Imagery curtesy Peter
Minton San Diego, California, USA
The Nicobar islands
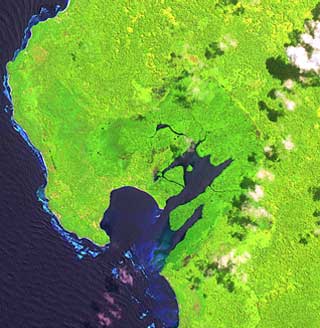
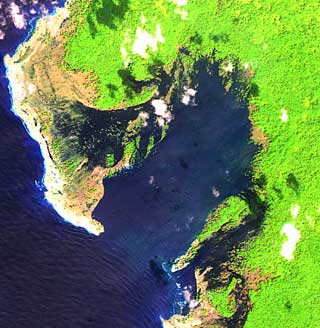
The western bay of Katchal island before (left) and after
(right) the morning of 26 Dec 2004 Credit: Images acquired and processed by CRISP, National
University of Singapore For more detailed satellite photographs of Katchall, go
to
IKONOS image © CRISP 2004
SPOT image © CNES 2004
ERS image © ESA 2004
TERRA Modis image, NASA 2004http://www.crisp.nus.edu.sg/tsunami/tsunami.html
http://www.crisp.nus.edu.sg/tsunami/Katchall_20041228_20040710/Katchall_20041228_20040710.html
|
|
Left: Trinket Island in the Nicobars: the low-lying and sandy island's outline before and after the tsunami (map drawn from satellite pictures). All of Trinket's inhabitants have been evacuated (mostly to Nancowry). It is not clear when or even whether they can return. The inhabitants' economic foundation (fishing and coconut plantations) have been severely damaged and it will take many years ifnot decades before the island can support the survivors.
|
Thailand
|
|
Arrival time (local) 26th December 2004, and height of the tsunami (1 m = 3.28 feet) Kata beach: 10:05 hours, max. height 4 m Patong beach: 10:06 hours, max height 5.5 m Kamala beach: 10:07 hours, max. height 5.3 m Khao Lak resort: 10:11 hours, max. height 10.6 m Phi Phi resort (off the eastern edge of the map): 5.8 m
Coastal parts most affected have been marked in transparent red.
Sea levels: 1. light blue: undisturbed, normal |
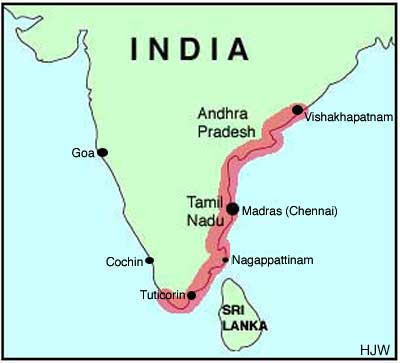
Mainland India
Left: In Tamil Nadu state, southwest India, the tsunami
destroyed the coast and with it much of the city of
Nagapattinam up to the red line drawn on the photograph.
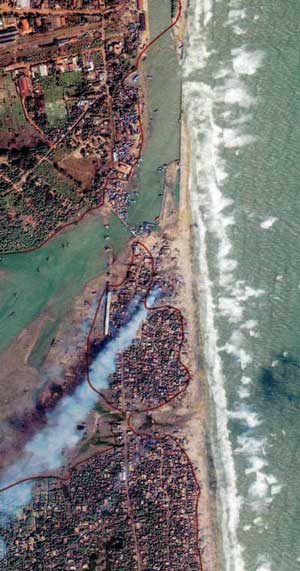
Tamil Nadu and Andhra Pradesh were both affected by the
destruction but Tamil Nadu more severely so. 2,200 km of the
east coast of India was devastated by the tsunami and around
14,500 people are known to have died or else are still
missing.In 900 villages 160,000 homes were destroyed and
650,000 people had to be evacuated. 12,000 hectares of
agricultural land were destroyed, 10,000 cattle drown and
74,000 fishing boats are said to have been damaged. Height of the tsunami: Vishakhapatnam (Andhra Pradesh): 2.35 m (1 m =
3.28 feet) Madras (Chennai) (Tamil Nadu): 2.5 m Nagappattinam (Tamil Nadu): 2 m Tuticorin (Tamil Nadu): 1.85 m Cochin (Kerala): 1.5 m Goa: 1.7 m
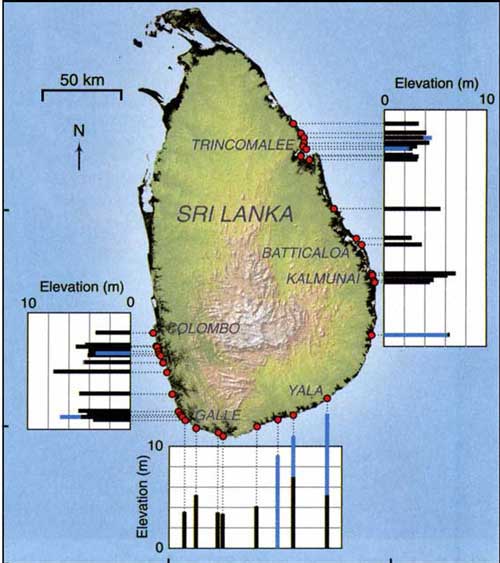
Sri Lanka
Coastal parts most affected have been marked in red. Red dots: bridges destroyed Black numbers: houses destroyed in that coastal
area Red
numbers:
dead and missing in that
coastal area X Site
of train derailed by tsunami with 1,000 dead
Height of the tsunami in Sri Lanka in m (1 m = 3.28
feet) black area: land less than 10 m above sea
level red dots: sites of measuring blue bars: measured tsunami run ups black bars: maximum tsunami heights Courtesy Liu P. L.-F., Lynett P., Fernando H., Jaffe
B.E., Fritz H., Higman B., Morton R., Goff J., and Synolakis
C. 2005. "Observations by the International Tsunami Survey
Team in Sri Lanka." Science 308:1595 (10 June
2005)
All figures below have to be rough approximations. It is in the nature and scope of the disaster that more precise figures are unlikely ever to be possible. For political reasons, some governments under-estimate while others over-estimate; also, internal unrest and civil wars in some countries make precise counting impossible. The numbers of the dead and the missing have been combined since more than two months after the disaster very few of those counted as missing will be found alive.
Country Dead and missing Injured Displaced Remarks Indonesia 320,000 100,000 700,000 Only the northern parts of the island of Sumatra is
affected Sri Lanka 44,000 35,000 580,000 Missing figure includes 19,000 claimed from areas under
control of Tamil Tiger insurgents India 22,000 - 380,000 Around 14,500 die on the east Coast of India east coast
of mainland India and in the Andaman & Nicobar
islands Thailand 14,000 8,500 - Dead include more than 2,400 foreigners (mostly
tourists) Burma (Myanmar) 800 45 3,200 Figures unreliable Somalia 300 - 5,000 Figures unreliable Maldives 134 - 20,000 Figures unreliable Malaysia 75 300 - Figures unreliable Tanzania 10 - - Figures unreliable Seychelles 3 - - Figures unreliable Bangladesh 2 - - Figures unreliable South Africa 2 - - Figures unreliable Kenya 1 2 - Figures unreliable Yemen 1 - - Figures unreliable Madagascar - - 1,000 Figures unreliable Total (approx.) 400,000 144,000 1,600,000
(presumed dead)
(temporarily or permanently)
Among the 350,000 inhabitants of the A&N islands there
ar3e more than 7,500 dead ; the Nicobars are more affected
than the Andamans
Foreign visitors (mostly tourists) to the countries directly affected have also been killed or are missing:
|
|
[ Go to HOME ] [ Go to The
Tragedy in pictures ] [ Go to Tsunami
NEWS ]
Last changed 1 January 2009